Boston’s 2026 FIFA World Cup experience produced many of the numbers cities hope to see when they compete for a major sporting event. Bars and breweries recorded a 28% increase in transaction volume during the tournament’s group stage, Greater Boston hotels posted a 20.7% year-over-year increase in average daily rate, and the MBTA recorded event ridership at levels far beyond previous major sporting events. Yet the latest evidence also shows a more complicated picture: some neighborhoods and businesses captured substantial gains while others saw little measurable benefit.
That uneven outcome could become one of the most important lessons from Boston’s World Cup. A successful mega-event is no longer simply a question of how much money enters a metropolitan economy. City officials increasingly need to determine where that money goes, which businesses capture it, how residents participate and what infrastructure remains useful after the crowds leave.
For Boston, that question is particularly relevant because the World Cup was only one part of an extraordinary 2026 calendar that also included the city’s 250th-anniversary celebrations and Sail Boston. The combined experience gives planners a rare opportunity to examine what worked, what did not and how future events can distribute economic activity more broadly.
Boston’s World Cup Numbers Were Strong, But They Tell Only Part Of The Story
The headline figures from Boston’s World Cup are difficult to dismiss.
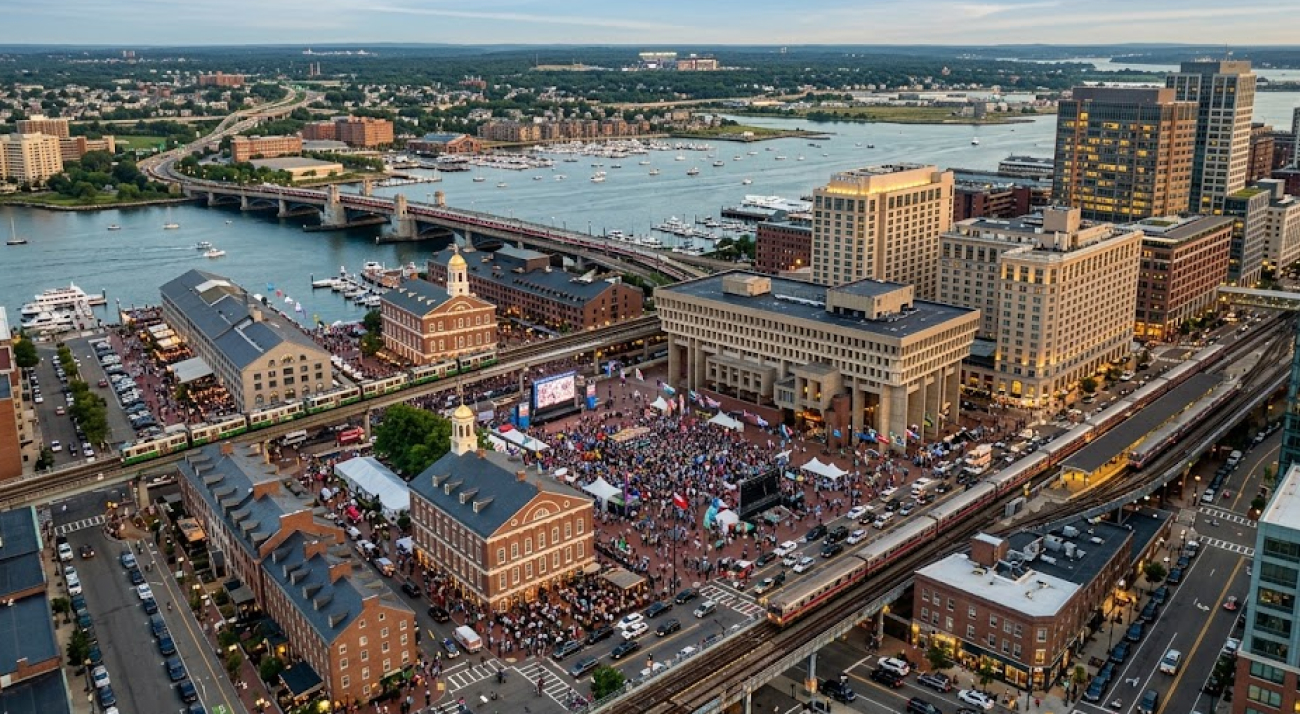
Seven matches were played at Gillette Stadium, temporarily renamed Boston Stadium during the tournament, with 447,283 fans attending those games. The tournament also brought approximately 160,000 visitors to the FIFA Fan Festival at City Hall Plaza, while more than 30 Massachusetts communities hosted watch parties.
The hospitality sector benefited significantly. Preliminary figures from Meet Boston covering June 12 through June 27 showed an average daily hotel rate of $410.44 and revenue per available room of $357.36, representing increases of 20.7% and 20.3%, respectively, compared with the same period in 2025. Greater Boston hotel occupancy remained around 87%, meaning much of the increase came through higher spending rather than dramatically higher occupancy.
That distinction matters.
Boston did not necessarily need millions of additional hotel guests to generate more tourism revenue. International visitors spent more per room and, in several parts of the hospitality economy, more per visit.
The Boston tourism economy therefore demonstrated one of the central advantages of major international sporting events: they can change the composition and spending behavior of visitors, not simply increase the number of people arriving.
But that success becomes less straightforward when the analysis moves away from hotels, downtown bars and major visitor districts.
Downtown Businesses Captured A Large Share Of The Immediate Upside
Boston’s downtown entertainment economy was one of the clearest winners.
Square data showed Boston bars and breweries experienced a 28% increase in transaction volume during the World Cup group stage, the largest increase among U.S. host markets tracked by the payment platform. Statewide bar and brewery revenue rose 8%, while late-night transactions between 10 p.m. and 1 a.m. increased by more than 20%.
Individual businesses reported even more dramatic results.
The Dubliner, located near the downtown fan activity, reported beer sales increasing by roughly 200%, while Boston Beer Company said Scottish supporters consumed four times as much Boston Lager at its taproom as during a typical busy July Fourth weekend. Hennessy’s reportedly exceeded its St. Patrick’s Day performance.
These examples show how a highly concentrated visitor event can create powerful commercial clusters.
Fans tend to congregate around transportation hubs, fan festivals, entertainment districts and businesses that already understand how to serve international visitors. The result is a multiplier effect: restaurants receive customers, nearby bars benefit from foot traffic, hotels capture overnight demand and transportation systems move people between them.
The problem is that these clusters do not automatically extend into every neighborhood.
The Uneven Impact Is The More Important Story
A citywide economic headline can hide significant differences between neighborhoods.
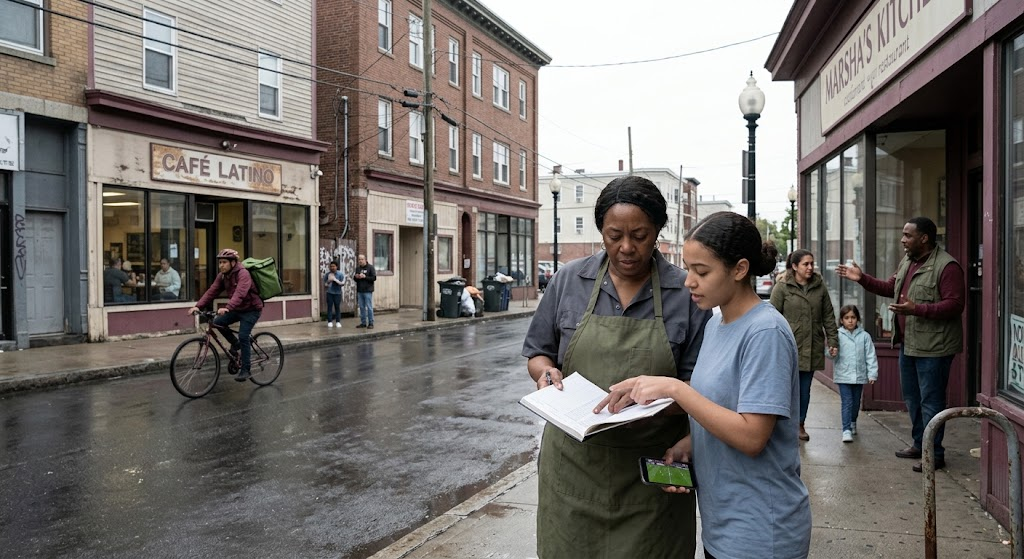
A recent review of Boston’s summer found that businesses in parts of downtown performed strongly while some businesses in neighborhoods such as Roxbury and Hyde Park saw considerably less benefit. The Black Economic Council of Massachusetts reportedly spent more than $155,000 of its own resources helping local businesses participate, highlighting concerns about whether public and event-related resources were reaching businesses outside the most visible visitor corridors.
That creates a difficult policy issue.
Boston can simultaneously have a successful World Cup and an uneven World Cup.
Both statements can be true.
The hotel sector can experience a 20% increase in room revenue while a neighborhood restaurant sees little additional business. Downtown bars can experience record sales while a small retailer several miles away receives no meaningful increase in visitors.
This is why future host-city planning will need to become more geographically precise.
Instead of measuring only citywide economic impact, officials could map where visitors stay, where they spend money, which transit stations they use and which neighborhoods receive secondary spending.
That would produce a much more useful picture of an event’s actual economic footprint.
Boston Already Tested Policies Designed To Spread The Benefits
One of the most interesting elements of Boston’s World Cup preparation was the effort to give businesses more flexibility during the tournament.
The city approved 211 requests from businesses across 25 ZIP codes to extend operating hours, while designated public drinking districts were created around parts of downtown. Among surveyed businesses eligible for extended hours, nearly half applied and used the option, with most reporting positive effects.
This is a relatively inexpensive form of event infrastructure.
Instead of building a permanent structure, Boston changed the regulatory environment so existing businesses could operate differently during periods of unusually high demand.
That is a potentially important lesson for other cities.
Major-event planning often focuses on stadiums, transit, security and public spaces. But regulations governing opening hours, alcohol service, outdoor activity, street use and temporary commerce can determine whether local businesses are actually able to participate.
Boston’s experience suggests that regulatory flexibility can function as economic infrastructure.
That idea could become especially important for smaller businesses that cannot afford large event activations or expensive marketing campaigns.
Transit Was A Major Success, But It Also Revealed The Scale Of The Challenge
The World Cup created an enormous transportation test for Greater Boston.
More than 108,940 round-trip tickets were sold between South Station and Foxboro Station from June 13 through July 9, nearly ten times the previous single-event record associated with the 2023 Army-Navy game. Keolis operated 98 round-trip event trains for the seven matches.
Subway ridership also increased sharply on match days.
Weekday ridership ranged from approximately 431,000 to 554,000, compared with an average weekday level of roughly 486,000 in May 2026. On Saturday, June 13, the system carried approximately 429,000 riders, more than 100,000 above a typical Saturday.
For Boston, this is more than a World Cup statistic.
It is a planning experiment.
The tournament demonstrated that the region can move extraordinary numbers of people when event schedules, commuter rail, subway service and destination planning are coordinated.
But it also showed why transportation needs to be integrated with economic-development planning.
If visitors arrive by rail but spend all their money within a narrow downtown corridor, the transit system has succeeded operationally without necessarily spreading the economic benefit geographically.
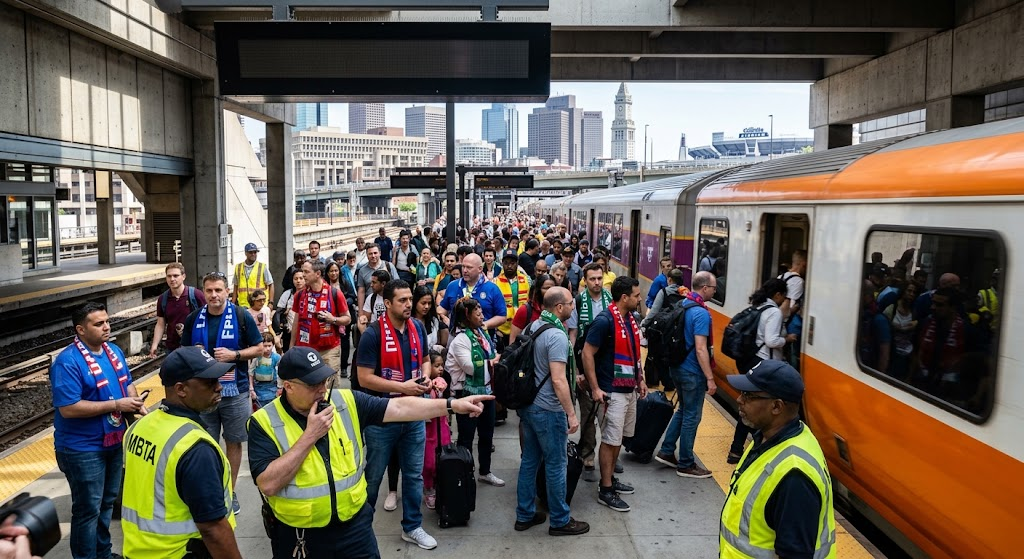
Future event planners should therefore examine not just how many people transportation systems move, but where those passengers go and where they spend.
The Stadium Was In Foxborough, But The Economic Event Was Greater Boston
Boston’s World Cup also demonstrates the difference between a host stadium and a host region.
The matches were played at Gillette Stadium in Foxborough, approximately 20 miles southwest of downtown Boston. Yet the tournament’s economic activity extended into hotels, restaurants, bars, transit systems, attractions and fan programming throughout Greater Boston. The official Boston 2026 strategy deliberately positioned downtown activities and the Fan Festival as complementary elements of the stadium experience.
That structure creates both opportunities and complications.
Foxborough receives match-day activity.
Boston receives international visitors, nightlife and cultural spending.
Other Massachusetts communities receive watch parties and visitors.
The transportation network connects them.
This suggests that future bids should perhaps be evaluated at the regional level, not simply by the municipality containing the stadium.
The economic footprint of a major sporting event rarely follows city boundaries.
International Visitors Can Change The Type Of Spending A City Receives
Another important lesson from Boston is that the value of international visitors cannot be measured only by headcount.
During the first two weeks of the tournament, Boston-area hotels reported approximately 87% occupancy, essentially matching the previous year’s level, while hotel spending and related tourism revenue increased by around 20%.
Economist Victor Matheson of the College of the Holy Cross noted that international World Cup visitors may have replaced some of the domestic tourism Boston would normally have received during the summer.
That raises an important distinction between incremental spending and displaced spending.
If an international visitor spends $1,500 in Boston but a domestic tourist who would normally have visited the city does not come, the net economic benefit is smaller than the gross visitor-spending figure suggests.
This is precisely why long-term event analysis should not rely exclusively on headline spending totals.
Cities need to know how much new money entered the local economy, how much spending shifted between businesses, and whether the event created demand that would not otherwise have existed.
Future Events Should Map Business Participation Before The Event Begins
Boston’s uneven results point toward a practical change in how cities could prepare for major events.
Instead of waiting until the tournament is underway to identify which businesses are benefiting, municipalities could create a business participation map months or years before the event.
That map could identify:
- Businesses located along visitor and transit corridors.
- Neighborhood businesses with limited access to event marketing.
- Minority-owned and locally owned businesses seeking participation.
- Areas requiring additional transportation or public-space programming.
- Districts where temporary events could generate new visitor flows.
The objective would not be to force visitors into neighborhoods artificially.
It would be to create legitimate reasons for visitors to explore more of the city.
Boston’s experience with the Fan Festival, extended business hours and public drinking districts provides a foundation for this kind of approach.
The Real Economic Question Is What Happens After The Tournament
The strongest argument for Boston’s World Cup will ultimately depend on what happens after 2026.
The tournament generated an estimated $1.1 billion economic impact before the event, based on projections involving approximately 2 million visitors, more than 5,000 jobs and $60 million in additional city and state revenues. Those figures were estimates rather than final results, and officials continue to analyze the tournament’s complete economic performance.
That distinction should remain central.
Projected economic impact is not the same as realized economic impact.
Gross spending is not the same as net new spending.
High hotel rates do not automatically mean every local business benefited.
And a successful event does not necessarily mean every neighborhood experienced a successful event.
Boston’s next step should therefore be a detailed post-event assessment that compares projections against actual outcomes and breaks the results down geographically.
That information could become one of the city’s most valuable World Cup assets.
Boston Could Build A Better Model For The Next Mega-Event
The city’s 2026 experience provides a useful blueprint precisely because it was not uniformly successful.
Boston demonstrated that international sports can drive hotel revenue, restaurant activity, transit ridership and global attention. It also demonstrated that economic gains can cluster around specific districts and industries.
That combination makes the city an unusually useful case study.
The next generation of host cities can learn from both sides of the equation.
| Planning Area | Boston’s 2026 Lesson | Future Event Strategy |
|---|---|---|
| Hospitality | ADR and RevPAR rose more than 20% | Track both spending and displacement |
| Restaurants | Downtown businesses captured major gains | Create neighborhood-specific visitor programs |
| Transit | Event ridership reached record levels | Connect transportation planning with spending patterns |
| Small business | Benefits varied by location | Build participation programs before events |
| Regulation | Extended hours helped participating businesses | Create temporary event rules in advance |
| Community impact | Some neighborhoods saw limited gains | Establish geographic equity targets |
| Fan programming | City Hall Plaza attracted major crowds | Use public spaces to distribute visitors |
| Measurement | Final impact remains incomplete | Publish neighborhood-level post-event data |
Boston also has another advantage: it has already shown that the city can coordinate multiple major events in a single summer. The World Cup was followed almost immediately by Sail Boston, while the city simultaneously celebrated the 250th anniversary of American independence.
That makes 2026 a rare planning laboratory.
Boston can compare how different events move visitors, how long they stay, what businesses they use and which neighborhoods capture the resulting spending.
The lesson for American cities is therefore broader than whether Boston’s World Cup was economically successful.
It is that major sporting events should be planned as citywide economic systems rather than isolated stadium spectacles.
The strongest host-city strategy will combine transportation, hospitality, public space, small-business participation and neighborhood investment from the beginning.
Boston’s World Cup delivered the crowds.
It delivered the hotel revenue.
It delivered record transit demand.
It delivered packed restaurants and bars.
But its most valuable contribution to future sports-event planning may be the question raised by the businesses that did not experience the same boom:
How can a city make sure the economic benefits of its biggest events travel farther than the crowds?
That question could shape how Boston approaches its next major international event—and how cities across the United States negotiate, plan and measure the next generation of mega-events.
That question could shape how Boston approaches its next major international event—and how cities across the United States negotiate, plan and measure the next generation of sports-event planning.
