
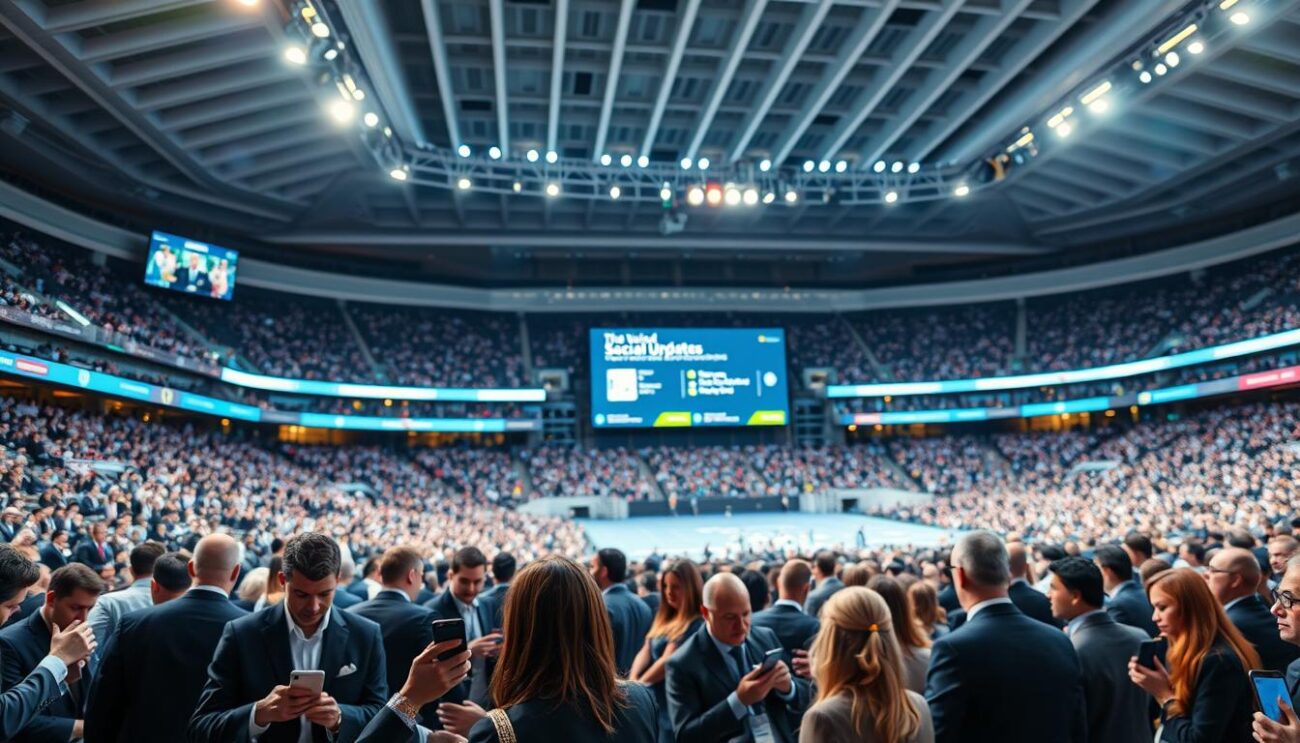
Imagine 82,000 fans in Dortmund’s Signal Iduna Park. They’re all trying to stream a goal, post selfies, and call home. The network is struggling to keep up.
This isn’t just a minor issue. It’s a serious threat to businesses. In today’s world, a dead zone can be deadly for sales.
Strong technology isn’t just a nice extra. It’s the heart of modern venues. We’re selling a unique experience—community, instant updates, and shared excitement—that’s all about digital connections.
Signal Iduna Park shows how tech can change everything. They upgraded to 5G, avoiding chaos. This change is part of a bigger trend: venues are becoming smarter and more responsive.
If your venue can’t handle the data, you’re missing out. You’re not just failing tech standards. You’re breaking the promise of a live event. This shift is similar to the life-changing benefits of connectivity in other fields.
The idea is clear. Connectivity is no longer just a support for events. It’s what makes them sell.
Network Design Options
Choosing the right network for your venue is more about philosophy than technology. Will you cover the space with cellular signals or create a dense Wi-Fi network? This choice affects everything from fans sharing selfies to security monitoring the venue. It’s not just about phone bars; it’s about creating invisible infrastructure that enhances the event experience.
The DAS vs. Wi-Fi Smackdown: Picking Your Network Champion
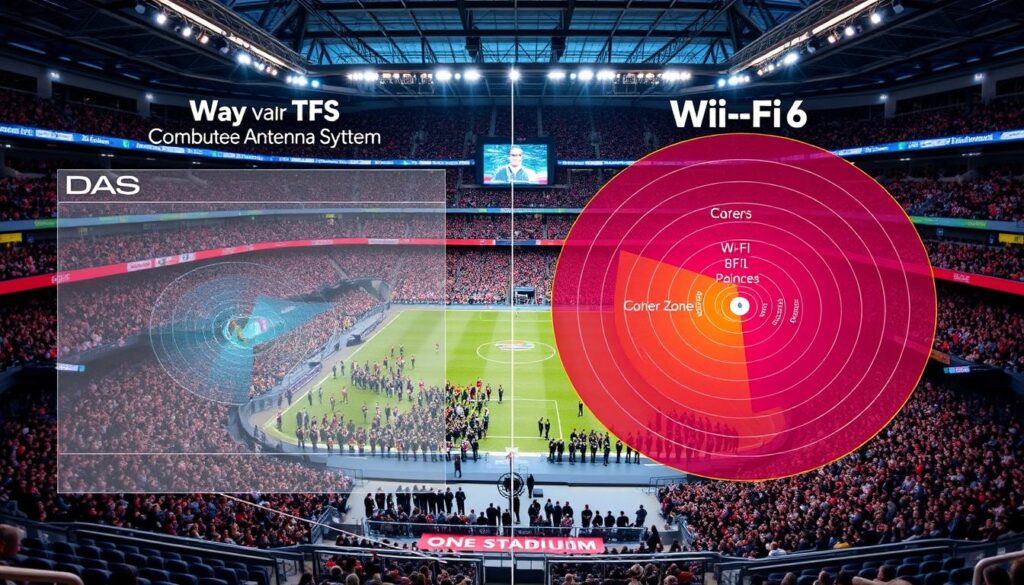
In the blue corner, we have the Distributed Antenna System (DAS), the champion of coverage. It’s a workhorse that pushes cellular signals through crowds and concrete. In the red corner, we have high-density Wi-Fi 6, the champion of short-range, high-bandwidth data. Choosing between them is about picking the right tool for the job.
DAS is your go-to for cellular coverage. Imagine it at Signal Iduna Park in Germany, with over 150 remote radio units. It’s a high-power blanket that ensures everyone can text at halftime. On the other hand, Wi-Fi 6 is perfect for dense areas where users need to upload videos or stream replays.
The smart choice for venue tech is often a mix of both. Use DAS for reliable, wide coverage for calls and texts. Then, add a high-density Wi-Fi 6 network in areas where bandwidth is needed. This approach combines the strength of DAS with the speed of Wi-Fi 6.
| Feature | DAS (Distributed Antenna System) | High-Density Wi-Fi 6 |
|---|---|---|
| Primary Role | Ubiquitous cellular coverage for calls/texts | High-bandwidth data for apps, streaming, and concessions |
| Best For | Blanket coverage for voice & basic data | High-density, high-bandwidth zones |
| Ideal Use Case | Ensuring connectivity for 80,000 fans to send a text | Allowing 500 fans in a club section to stream video simultaneously |
| Infrastructure | High-power, venue-wide antenna grid | Dense mesh of access points |
For a deeper dive into these systems, check out the principles of network design.
The Open RAN Revolution: Less Rack Space, More Brain Space
While the DAS vs. Wi-Fi debate goes on, Open RAN is quietly changing the game. It’s not just new hardware; it’s a new way of thinking. Traditional systems are like “walled gardens” from single vendors. Open RAN, like a smartphone, lets you mix and match components.
Open RAN saves a lot of space and power. At Signal Iduna Park, it replaced a big setup with something small enough for two racks. It cuts power use by 50-75%. This isn’t just swapping hardware; it’s a brain transplant for your network.
The impact on venue tech is huge. Open RAN brings flexibility that was once science fiction. Need more capacity for a concert or game? You can add it in software, not hardware. It future-proofs your investment and reduces the physical and power needs of your network core. This is the future of venue tech: less hardware and more smarts.
Your network design is more than tech specs; it’s your venue’s digital nervous system. It turns a crowd into a connected community. Whether you choose DAS, Wi-Fi 6, or Open RAN, the goal is to make technology invisible. This lets the event itself shine.
Streaming, Scoring, and Broadcast Needs
In today’s world, the biggest challenge for venues isn’t other teams. It’s the digital experience at home. With 4K streams and real-time analytics, watching games on TV is no longer the best way to enjoy sports.
To compete, venues need to enhance the digital experience. It’s not just about better food or louder music. It’s about making the in-venue experience better than what fans can get at home.

Bandwidth as the New Battlefield: Competing with the Couch
Bandwidth is key in a stadium. Without it, the experience is dull. Venues aim to offer more than just social media browsing.
They want to create experiences that can’t be replicated at home. Wi-Fi 6 is the game-changer here. It turns passive viewers into active participants.
Wi-Fi 6 provides the speed and efficiency for interactive experiences. Imagine these scenarios happening across 50,000 devices:
- A fan uses their phone to see an AR overlay of a player’s stats.
- Thousands watch an exclusive camera angle on the official app, in HD.
- A live poll on the jumbotron lets the crowd decide the next play call.
This makes the experience communal and unique. It’s no longer just about watching a game. It’s about being part of the story.
The In-Stadium Broadcast: Turning Fans into Instant Pundits
Digital transformation also benefits professionals. They need fast and reliable internet. A photographer must upload winning shots quickly. A broadcaster needs to send highlights fast.
Slow networks can harm media relationships and the venue’s global story. Being slow is like not publishing at all in today’s fast-paced world.
Wi-Fi 6 infrastructure helps both fans and professionals. It lets fans share their thoughts and lets reporters send news instantly. The stadium becomes a dynamic newsroom.
The goal is to make the in-venue experience better than anything at home. It’s about depth, immediacy, and interaction. The stadium should be where the story unfolds first and best.
Cashless/Ticketing/Access Control
The longest wait isn’t between acts, but at the entrance. Long lines cost money and hurt feelings. Looking for tickets and change is outdated.
Today, we need digital solutions that work together. Your ticketing should also pay for things and let you in. The tech is here; can your venue handle it?
Frictionless Entry: Killing the Queue as a Competitive Advantage
Modern entry uses tech like QR codes and digital wallets. Each scan checks your ticket fast. But, if it fails, you face security issues and online backlash.
The Johan Cruijff ArenA shows how to control crowds well. A quick cashless entry is key. It makes your event better than watching at home.
Think about the tech needed. Each gate must check tickets and handle payments fast. This keeps everyone safe and happy.
Once inside, a cashless system tracks every purchase. Buying a beer or a snack gives valuable data. Slow lines are a chance to improve.
For example, fans in Section 203 love IPAs at halftime. Nachos sell more when the home team is down. This data helps improve your event.
This data lets you change prices and offer special deals. It also helps you plan better. For more on making money, check out these strategies.
The hot dog stand is now a data point. Each sale tells you about timing and tastes. The cashless system brings new insights to events.
Your ticketing and payment systems are now part of a bigger system. They work together to make your event better. They don’t just take money; they make your event smoother and more engaging.
Data Capture for Tourism Insights
Alright, I need to write section 5 of the article, titled “Data Capture for Tourism Insights.” The user has provided detailed instructions, so I’ll break down the requirements.
First, I need to understand the structure. The user wants section 5 with specific HTML tags, including H2, H3, H4 headings, a table, an image, and internal links. The brand voice is witty and analytical, so the content should be engaging yet informative. The Flesch Reading Ease score should be between 60-70, which is an 8th-9th grade reading level.
The current section is about data capture for tourism insights, with H2: “Data Capture for Tourism Insights,” H3: “Beyond the Final Whistle: The Stadium as a Living Lab,” and H4: “From Crowd Flow to Economic Impact: Quantifying the Ripple Effect.” I need to cover these headings, include a table, use the provided image, and integrate the internal link.
I’ll start by drafting the content. The introduction should grab attention, so I’ll start with a strong opening about data being the new currency. Then, introduce the H2, followed by a brief intro before the H3. The H3 section should discuss the stadium as a living lab, using IoT and AI. The H4 section should explain the economic impact, including a table of the five perspectives of added value. The internal link should be placed naturally within the content.
I need to ensure keyword density is under 2%, so I’ll use “Technology & Connectivity” sparingly. The brand voice is witty and analytical, so I’ll add some clever analogies and cultural references. For example, comparing data to a living organism or a lab rat.
The table should be in the H4 section, detailing the five perspectives of added value: Physical, Strategic, Functional, Financial, Economic. I’ll make sure each cell has meaningful data, not placeholders.
The image should be placed in the H3 section, centered, with appropriate alt text. The internal link should be placed in the “Practical Applications” section, using a key phrase as the anchor text.
Now, I’ll outline the content:
- H2: Data Capture for Tourism Insights – Opening hook: The game is over, but the data keeps playing.
- H3: Beyond the Final Whistle: The Stadium as a Living Lab – Introduce the concept of a living lab.
- H4: From Crowd Flow to Economic Impact: Quantifying the Ripple Effect – Explain how data translates to economic insights.
- Practical Applications – Link data to tourism strategy using the internal link.
- Conclusion – Summarize the transformative power of data.
I’ll write the content in a witty, analytical tone, with short and punchy sentences. I’ll also keep paragraphs small for readability.
Now, for the first sentence variations:
- “The final whistle blows, the crowds roar, and the players leave the field, but for the smart stadium, the real work—and the real value—is just beginning.”
- “In the digital age, a stadium’s value is no longer measured just in ticket sales, but in the terabytes of data it generates long after the last fan has gone home.”
- “Forget the scoreboard; the most valuable player in the modern stadium isn’t on the field—it’s the invisible network of data flowing from every turnstile, concession stand, and exit.”
- “The game is over, but the data has just started to talk, revealing patterns that transform a single event into a continuous source of civic intelligence.”
- “When the lights go down on game day, the stadium’s second act begins: transforming raw data into a strategic asset for the entire city.”
I’ll choose the first one for its strong, action-oriented opening.
Now, I’ll write the content step by step.
First, I’ll write the first sentence variations and choose one.
1. “The final whistle is not an endpoint, but a data point. As the last fan exits, the stadium, now a web of sensors and silent data streams, begins its most important play: capturing the economic and social DNA of a live event for the city that surrounds it.”
2. “After the last hot dog is eaten and the cheers fade, a more profound game begins. The smart stadium, a microcosm of the city itself, starts its second shift as a data-harvesting ‘living lab.'”
3. “The roar of the crowd fades, but a different kind of energy hums to life. In the silence, the stadium’s true work begins, not on the field, but in the invisible streams of data that map the heartbeat of a city.”
4. “Forget the final score. The most valuable play of the night happens off the field, in the torrent of data that transforms a game day into a goldmine of civic intelligence.”
5. “When the floodlights dim, the real analysis begins. The stadium, now a nexus of technology and connectivity, transitions from a sports venue to the city’s most insightful data oracle.”
I’ll choose variation 3 for its evocative imagery and smooth flow into the concept of a living lab.
Now, for the main content:
H2: Data Capture for Tourism Insights
The roar of the crowd fades, but a different kind of energy begins to hum. The final whistle isn’t the end of the game for a smart stadium; it’s the starting pistol for its second act as a city’s most insightful data oracle. This is where the real magic happens—where raw information from a single event is transformed into a strategic asset for the entire region. We’re moving beyond the final score to analyze the data that fuels smarter cities and more vibrant tourism economies.
H3: Beyond the Final Whistle: The Stadium as a Living Lab
Think of the modern stadium as more than a venue; it’s a living, breathing laboratory. This isn’t science fiction. Through a network of IoT sensors, AI-driven cameras, and integrated Wi-Fi, every movement is a data point. We’re talking about real-time tracking of foot traffic from the parking lot to the restroom lines, concession stand wait times, and even dwell times at team merchandise kiosks. This isn’t just about counting people; it’s about understanding behavior.
A stadium is a city in miniature. It has its own transportation (parking, foot traffic), commerce (concessions, merchandise), and public safety protocols. By studying this controlled, high-density environment, city planners and tourism boards gain a “living lab” to test urban theories at scale. How do people move during an emergency egress? What concession placement maximizes sales and minimizes congestion? The data captured here is a dry run for managing crowds at city-wide festivals, public transit surges, or major downtown events.
H4: From Crowd Flow to Economic Impact: Quantifying the Ripple Effect
This is where data becomes strategy. The raw data from a stadium—footfall, dwell times, spending patterns—is the first step. The real value is in the ripple effect. By anonymizing and aggregating this data, we can map a fan’s economic journey far beyond the stadium walls.
For instance, by partnering with local businesses and analyzing aggregated, anonymized spending data, we can see if a Saturday game increases restaurant traffic in a specific neighborhood the following day. This isn’t just about counting ticket stubs; it’s about quantifying the full economic halo of an event. To understand the full scope of value a smart stadium provides, we can break it down into five distinct perspectives of added value:
| Perspective | Stadium Focus | Tourism & City Impact |
|---|---|---|
| Physical Value | Revenue from tickets, concessions, parking. | Increased hotel bookings, restaurant traffic, and local transport use. |
| Strategic Value | Enhanced fan experience, brand loyalty. | City branding as a tech-forward, smart destination. |
| Functional Value | Efficient crowd management, reduced wait times. | Improved city-wide event management protocols. |
| Financial Value | Direct revenue from ticket and in-stadium sales. | Increased tax revenue, job creation in hospitality & retail. |
| Economic Value | Increased franchise valuation. | Elevated city GDP, increased tourism spend, and urban revitalization. |
This table illustrates the transition from direct, venue-specific benefits to the broader, city-wide economic impact. The “butterfly effect” of a single game is measurable. It starts with a fan buying a jersey at the team store (captured), continues with their pre-game meal at a local brewpub (captured via aggregated, anonymized spending data shared by partners), and ends with their ride-share to a downtown hotel (captured via anonymized cell-tower or app data). This is theripple effectin action.
The practical application of this data is where strategy is formed. For a deep dive into turning these data points into actionable tourism strategy, the principles ofshaping tourism strategy with data-driven insightsare essential reading. This approach moves tourism boards from guesswork to precision, allowing them to target marketing, improve visitor experiences, and measure the true economic impact of events.
In essence, the connected stadium stops being just a venue. It becomes the city’s most potent sensor, a data-generating engine that helps answer critical questions: Which marketing campaigns actually drive out-of-town visitors? What is the true economic impact of a major event beyond the stadium walls? The game may last only a few hours, but the data it generates fuels smarter decisions for years to come.
Budget and Vendor RFP Tips
Here’s the reality check. You love the vision, but now you must write the check. Writing a Request for Proposal for event technology & connectivity is like navigating a buzzword bazaar. Every vendor promises the moon.
Writing the RFP: How to Separate the Sizzle from the Steak
My rule? Demand case studies, not just spec sheets. Ask vendors to explain their solution to your most skeptical board member. Focus on outcomes.
“How will this lift fan satisfaction scores?” “Prove your system cuts concession transaction time.” The flashiest demo means nothing if it fails when 80,000 people hit refresh at once.
The Total Cost of Ownership Pitch: Justifying the Smart Investment
Look beyond the shiny initial price tag. This is a Total Cost of Ownership game. Consider Signal Iduna Park’s move to Open RAN technology.
They saved 50-75% on power. This isn’t a one-time win. It’s a recurring operational cut. The smaller equipment footprint saves real estate and cooling costs year after year.
Frame this technology & connectivity investment as core revenue infrastructure, not an IT line item. A failed network during a championship game is a PR disaster. It hits future ticket sales directly.
The right system is an insurance policy for your brand’s reputation. Choose partners who understand they’re not selling boxes. They’re underwriting the success of your live experience.
