

Let’s face it: Cities aren’t Little League teams, but too many treat stadium deals like trading baseball cards. When your town bets millions on arenas or tournaments, how do you know if you’re scoring a World Series win or striking out with taxpayer cash? That’s where sports event economic measurement swings for the fences.
The OECD’s triple bottom line approach cuts through the hot dog vendor math. Think of it as Yelp reviews for civic investments: Does that Formula 1 race boost local jobs (people), pad hotel taxes (profit), and leave parks cleaner than a rookie’s uniform (planet)? Spoiler: Most don’t.
Take a page from Olympic analysts at AISTS. Their playbook tracks everything from Uber receipts to midnight pizza orders—because real economic impact of sporting events isn’t just ticket sales. It’s the bartender’s tips, the parking lot revenue, and the guy selling $8 bottled water.
Here’s the curveball: Modern metrics expose vanity projects faster than a juiced ball. Why? Because cities using these tools aren’t playing financial T-ball anymore. They’re calculating ROI like Wall Street meets Wrigley Field.
Introduction to Economic Impact Measurement
Today’s mayors face a big challenge. They need data, not just dreams, to avoid financial trouble. Cities once spent a lot on stadiums, hoping for success. But the OECD’s event lifecycle impact model shows a different path.
Why hope isn’t enough for sports economic assessment. The first phase is all excitement and promises. But then, reality hits hard. 63% of big events go over budget within 18 months, according to OECD data.
So, why do cities end up with useless stadiums? They mix up economic impact tools with magic. The OECD matrix reveals three harsh truths:
- Tourism spikes are often shorter than a halftime show
- Local businesses get tackled by supply chain leaks
- “Legacy” infrastructure frequently becomes budgetary dead weight
The third phase is all about uncertainty. Is that old stadium a treasure or a waste of money? It depends on who you ask. The smart move? Study every detail before making a decision.
Here’s the main point: Cities that ignore economic impact tools are not visionaries. They’re like sports Atlantises in training. When the cheering stops, mayors need solid reasons for their spending.
Core Metrics Used: Direct, Indirect, and Induced Effects
Imagine a Little League tournament coming to town. Suddenly, Main Street is buzzing like Black Friday at a Nike store. But how do we know what’s real and what’s just numbers? Let’s explore the three key financial forces that turn small investments into big wins.
The Economic Trifecta
Every dollar spent at a community based sports tournament is like a speedy relay runner. First, there’s the direct effect – like hotel bookings and nacho sales. Then, the indirect effect kicks in, with the hotel buying more towels and the nacho factory hiring more workers. Lastly, the induced effect brings in the final win when those workers spend their earnings at local breweries.
Manchester’s Olympic transformation is a great example. Their £10 million velodrome investment grew to £27 million in regional growth. This happened through:
- Direct: Construction jobs and ticket sales
- Indirect: Steel suppliers expanding operations
- Induced: Engineers buying pints at revived pubs
Mathletes vs Meatheads: Why Multipliers Matter
Economic multiplier sports events get really interesting here. The AISTS Keynesian model shows most cities lose value like a deflated basketball. For every dollar spent:
| City Type | Direct Retention | Total Multiplier |
|---|---|---|
| Major Metro | $0.80 | 2.1x |
| Rural Community | $0.55 | 1.4x |
OECD input-output tables highlight why community based sports tournaments are so powerful. Local vendors mean more money stays in the community. But choosing a Marriott over Mom’s B&B? That’s 30% of your impact lost to corporate profits.
The real magic is when induced effects create lasting jobs. Manchester’s Olympic housing now hosts tech startups – a huge economic boost. Just remember, multipliers aren’t magic beans. Use them wisely, or you’ll end up with empty stadiums like Detroit’s or ghost courts like Memphis’.
Common Economic Impact Tools
Economic impact analysis is more than just spreadsheets and reports. It’s where data science meets stadium economics. The right tools can turn vague promises into hard numbers. But, not all tools are created equal.
From STEAM to Snake Oil
Let’s talk about the big players. Sport Tourism Economic Assessment Model (STEAM) is like Tony Stark’s Jarvis for event planners. It crunches numbers like hotel taxes and Uber receipts into predictive models. Vancouver used it to find the Grey Cup’s $140M economic impact.
The OECD’s GRAT framework is like a forensic accountant. It looks at long-term impacts, like Paris 2024’s Olympic infrastructure ROI until 2034.
But not all tools are superheroes. The market is full of:
- “Drag-and-drop” calculators that promise too much, too fast
- Old models that count fax machine rentals as economic drivers
- AI tools that make up attendance numbers like ChatGPT inventing citations
| Tool | Superpower | Kryptonite |
|---|---|---|
| STEAM | Real-time predictive modeling | Requires PhD-level data input |
| OECD GRAT | 10-year legacy tracking | Eurocentric bias |
| ImpactCalc Pro | User-friendly interface | Overestimates local spending |
Cities like Indianapolis use a mix of tools. They use STEAM for hype and OECD frameworks for reality checks. The goal is to avoid being the next big disappointment.
Pros and Cons of Each Method
Let’s get real about the economic impact of sports events. Every method has its own set of challenges. Whether you’re looking at sports events tourism impact or the benefits of hosting sporting events, how you measure it is key.
Lies, Damned Lies, and Impact Statistics
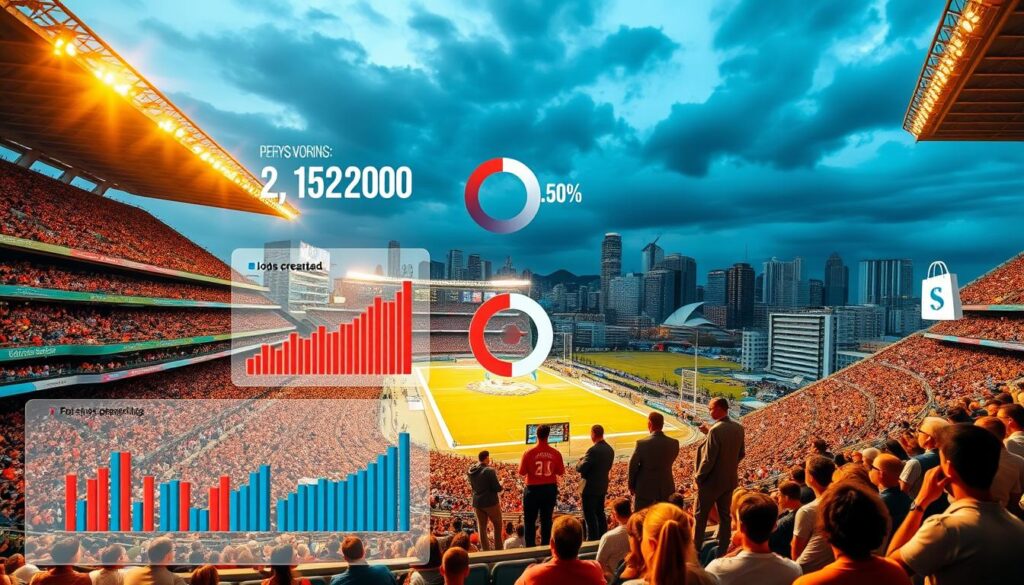
Input-output models are all the rage in economic studies. They’re flashy but often flawed. They might count every hot dog sold but overlook where the buns came from.
Tourism studies have their own issues. They often claim festivals boost hotel stays without solid evidence. Montreal’s Olympic debt from 1976 is a clear example of this problem.
- The Good: AISTS’ Swiss-watch approach that factors in displaced spending
- The Bad: Models assuming every tourist would’ve stayed home
- The Ugly: Studies using old data for new event impacts
OPEC’s guidelines are like a financial truth serum. They have three key questions for impact studies:
- Does it differentiate between new and relocated spending?
- Are opportunity costs calculated?
- Can we audit the data sources?
When Salt Lake City applied these guidelines to their Winter Games bid, they found their numbers needed a rethink. The final figure had fewer zeros and more asterisks.
Best Practices for Local Leaders and Organizers
Hosting a big tournament without the right team is like a small team facing the ’92 Dream Team. To succeed, you need experts who can turn numbers into big wins. Edmonton’s Ice District went from empty space to a $2.5B economic powerhouse using OECD-aligned stakeholder strategies.
Building Your Impact SWAT Team
Your team needs three main roles:
- Data Sheriffs: Keep track of every dollar
- Community Liaisons: Use money to improve local areas
- Legacy Trackers: Look at long-term benefits
| Role | Key Responsibility | Success Metric |
|---|---|---|
| Vendor Quarterback | Get local businesses involved | % of contracts staying in-region |
| Hotel Sleuth | Monitor room nights and rates | Average daily rate vs. baseline |
| Survey Architect | Make fan spending surveys | Response rate accuracy |
Edmonton’s success came from treating their 2018 NHL playoff like a Broadway show. Every department had a plan. Hotels and transit apps worked together. Even Uber drivers helped track the economy.
Timeout-worthy tips for rookie organizers:
- Use RFID chips in wristbands to track fans
- Make vendors report sales digitally
- Work with universities for studies after the event
At the 2023 NBA All-Star Game in Salt Lake City, their team used phone data to show $189M in spending. This shows the value of treating local economy sports tournaments as data goldmines.
Want to improve? Check out ways to boost economic impact. These strategies can make temporary events into lasting community benefits. In sports event community development, the real win is years after the event.
Real-World Case Examples
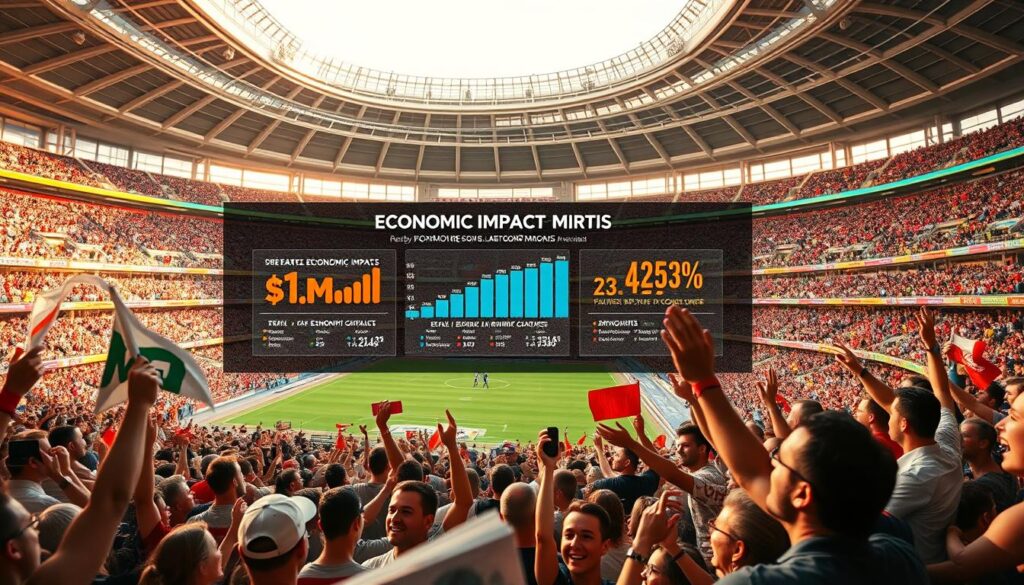
Let’s dive into the financial world where spreadsheets meet stadium receipts. These aren’t just theories—they’re economic cage matches with real winners and losers. Sometimes, there are even magic accounting tricks that would make Houdini jealous.
When Spreadsheets Meet Stadiums
Nashville’s NHL gamble is a great example. When the Predators arrived in 1998, critics thought it would fail. But now, the team’s $500M+ annual impact shows hockey works in Tennessee. Yet, 30% of their hotel revenue boost came from bachelorette parties in Broadway’s honky-tonks. Always check the details behind the stats.
Barcelona’s 1992 Olympic Games are a success story. The city turned old industrial areas into beautiful waterfronts. But, local vendors wonder if the 12% tourism spike lasted long after the games. Remember, lasting legacies are more important than flashy openings.
- Indianapolis’ NCAA hustle: Turned March Madness into a $500M/year industry with smart analytics. They tracked everything from nacho sales to Uber routes.
- Paris 2024’s pre-game: Already using bed tax projections to fund metro upgrades before tourists arrive.
Now, let’s talk about the dark side. Ever heard of visitor spend attribution? It’s like claiming credit for your neighbor’s WiFi. Cities often count spending from commuters and shoppers as event-related revenue. One Midwestern city even counted dentist convention spending in their Super Bowl report. That’s bold.
Hotel math is like a reality show. The bed tax shell game works by raising rates 5% during events. Then, they attribute all revenue increases to visitors. It ignores the fact that locals might be fleeing Airbnb squatters. It’s creative accounting at its finest.
These examples show that sports economics is about storytelling with numbers. It’s not just about making money. It’s about who gets to write the final score.
Getting Started: Building Your Own Assessment
Time to swap your clipboard for a profit calculator. Building an economic impact assessment is like coaching a little league team. It’s all about the numbers and how they add up.
The secret is to think of it as a three-act sports drama. First, you have the pre-game warmups (baseline data). Then, the live gameplay tracking (real-time metrics). And last, the post-game film review (legacy audits).
Your Playbook for Fiscal Accountability
Let’s break down STC’s implementation framework. It’s like Moneyball meets municipal budgeting. First, you need to establish your baseline snapshots using pre-event surveys.
These aren’t your average “how did you hear about us?” forms. We’re talking about detailed tracking of:
- Local hotel occupancy rates 90 days pre-event
- Average restaurant sales during comparable weekends
- Parking revenue patterns at municipal lots
During the event, use what I call “economic surveillance” tactics. Track real-time credit card spending within 10 miles of venues. It’s like having X-ray vision for visitor wallets.
| Assessment Phase | Key Metrics | Tools Needed | Time Commitment |
|---|---|---|---|
| Pre-Event (3-6 months prior) | Baseline hotel rates, local biz inventories | STC Baseline Survey Template | 40-60 hours |
| Live Event | Real-time spending, occupancy spikes | Hotel PMS integrations | 24/7 monitoring |
| Post-Event (30-90 days) | Tax receipt analysis, legacy effects | OECD Audit Framework | 80-100 hours |
The real magic happens in the post-event autopsy. Compare your projections to actual hotel revenue bumps and vendor sales data. Pro tip: Partner with local tourism boards to track return visits. That’s where the long-term economic impact of sporting events truly shines.
Ready to suit up? Grab our ROI Rookie Kit – packed with templates that helped a Saskatchewan junior hockey town prove their $2.3M economic impact. Includes:
- Customizable hotel revenue tracking dashboard
- Vendor impact survey script (approved by OECD researchers)
- Post-event press release template with data visualization guidelines
Remember: In the game of economic impact analysis, the final score isn’t just about immediate dollars. It’s about proving your event deserves that municipal subsidy – and maybe funding next season’s championship bid.
Conclusion
Paris 2024’s €8.8 billion Olympic gamble shows the high stakes in measuring economic impact. We’re not just talking about whether stadiums boost growth. We’re looking at who really counts the wins.
The OECD wants standardized measurements, not just for the sake of it. It’s about making sure we build economic engines, not just empty stadiums like Detroit’s Silverdome.
Every sports economic assessment has a choice to make. Will you be like Atlanta ’96, transformed by the Olympics, or Montreal ’76, stuck with a 30-year debt? Your work needs to be as precise as a Formula 1 pit crew.
Your analysis must be as sharp as VAR checking for offsides. If not, you’ll just be another statistic in papers about financial mistakes.
This isn’t about killing civic pride. It’s about making it through the tough times. Cities that use the right tools for sports economic assessment can turn cheerleading into winning plays.
They can turn vague promises into clear, Super Bowl-level transparency. They can switch from generic tourism claims to precise numbers on jobs and taxes.
The score is clear. Cities that master measuring economic impact don’t just host games. They rewrite the economic playbook. Those who don’t? They become stories of municipal bankruptcies on ESPN.
The OECD’s whistle is blowing. It’s time to show you’re playing Moneyball with public funds, not just playing with Monopoly money.
