
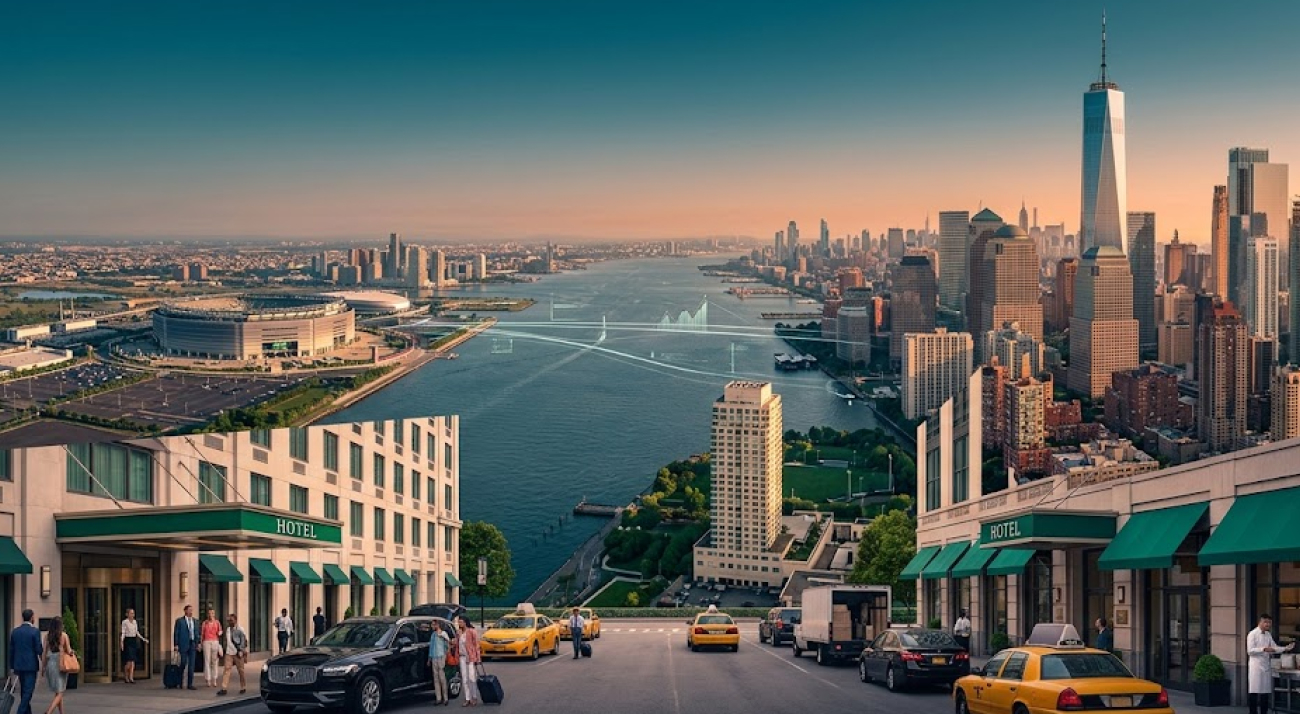
The 2026 FIFA World Cup has given New York and New Jersey one of the strongest economic-impact figures associated with the tournament anywhere in the United States. A final analysis released August 26 by Tourism Economics, an Oxford Economics company, estimated that World Cup activity generated $3.5 billion in total economic impact across the two-state region, exceeding the original $3.3 billion projection. The tournament generated approximately $1.9 billion in direct spending, $1.4 billion in labor income and $414.2 million in state and local tax revenue, while supporting 27,424 full- and part-time jobs.
The scale was substantial. More than 645,000 fans attended eight matches at New York New Jersey Stadium in East Rutherford, including the July 19 FIFA World Cup Final. Another 626,300 non-local visitors traveled to New York or New Jersey for World Cup-related activities, including official fan experiences. Together, match and non-match visitors generated approximately $1.7 billion in direct spending across the region.
Those numbers strengthen the argument that hosting a global sporting event can generate significant economic activity. They also raise a more difficult question: how much of that economic value remains after the costs of hosting, transportation, security and infrastructure are included?
That question could influence how American cities negotiate future mega-events.
New York And New Jersey Beat The Original Projection
The region entered the World Cup with an ambitious economic forecast.
In July 2025, the New York New Jersey Host Committee projected that the tournament could generate $3.3 billion in economic impact, support more than 26,000 jobs and attract more than 1.2 million visitors. That preliminary estimate was also developed with Tourism Economics.
The final $3.5 billion figure therefore represents an increase of roughly $200 million, or about 6%, over the original projection.
That difference matters because economic-impact projections are often criticized when they are treated as promotional tools rather than testable forecasts. In this case, the final estimate exceeded the original number, giving the host region a stronger argument that its World Cup planning produced the anticipated economic activity.
But the methodology behind the $3.5 billion figure is just as important as the headline number.
The report separates the tournament’s economic effects into direct, indirect and induced activity. Approximately $1.9 billion came from direct spending, while additional economic activity was generated as businesses purchased goods and services from other businesses and workers spent their income within the regional economy.
That distinction is critical.
A visitor paying $500 for a hotel room represents direct spending. The hotel’s purchases from local suppliers represent indirect activity. The spending by employees whose wages are supported by that visitor demand represents induced activity.
The final $3.5 billion figure therefore represents the broader economic ripple effect rather than $3.5 billion in money physically spent by visitors.
The Eight Matches Created A Concentrated Tourism Surge
The region’s eight matches provided the foundation for that economic activity.
More than 645,000 people attended the matches, with the tournament culminating in the World Cup Final at the former MetLife Stadium on July 19. The stadium’s location in East Rutherford gave the event a distinctive regional character because the matches were officially hosted by New York and New Jersey but physically staged in New Jersey.
That geography matters when evaluating who benefited.
Fans could stay in Manhattan, Brooklyn, Queens, Jersey City, Newark or other parts of the metropolitan region while traveling to the stadium for matches. Spending could therefore cross state and municipal boundaries throughout the tournament.
The economic footprint was not limited to stadium tickets.
The report estimates approximately $653 million in accommodation spending, $264 million in retail spending, $200 million in transportation spending and $195 million in recreation and entertainment spending. Operational spending associated with organizing the tournament added another approximately $286 million.
This diversified spending pattern is one reason mega-events can be attractive to major metropolitan areas.
A World Cup match creates demand for hotels, restaurants, bars, transportation providers, retailers, attractions, security companies, event staff and other businesses simultaneously.
The challenge for policymakers is determining whether that activity represents a temporary surge or a lasting improvement in the regional economy.
The $414 Million Tax Figure Changes The Conversation
The $414.2 million in state and local tax revenue is arguably one of the most important numbers in the report.
Unlike gross visitor spending, tax revenue gives governments a more direct financial return from the increased economic activity. The figure includes taxes generated across the regional economy as visitors spent money and businesses responded to increased demand.

This provides a stronger foundation for comparing economic benefits with public costs.
If governments spend $1 on infrastructure and receive $2 in additional tax revenue, the public-sector case becomes easier to defend. If they spend $1 and receive only a fraction of that amount, the calculation becomes more complicated.
The World Cup therefore illustrates why host-city analysis should distinguish between economic output and fiscal return.
A region can generate billions in economic activity without government necessarily collecting billions in revenue. Conversely, a smaller event with strong local tax generation could potentially produce a better fiscal return than a much larger event.
That distinction could become increasingly important as U.S. cities compete for future international sporting events.
New York and New Jersey now have an unusually large data set with which to examine that question.
New Jersey’s Transportation Costs Reveal The Other Side
The economic-impact figure becomes more complicated when transportation costs enter the equation.
Before the tournament, New Jersey officials publicly challenged the financial arrangement surrounding NJ TRANSIT. In April, Governor Mikie Sherrill said the World Cup mobility plan would cost NJ TRANSIT at least $48 million, while arguing that FIFA should help cover the cost of transporting fans.
The dispute highlighted a fundamental problem in mega-event economics.
The organization staging the event can generate enormous commercial value while public transportation agencies must expand service, increase staffing and provide specialized operations to accommodate spectators.
The region’s transportation strategy was extensive. NJ TRANSIT, the Port Authority of New York and New Jersey, the Metropolitan Transportation Authority, the New Jersey Department of Transportation, the New Jersey Turnpike Authority and Amtrak coordinated operations for the tournament. NJ TRANSIT was expected to carry approximately 40,000 attendees per matchday, with ticketing restrictions and dedicated matchday procedures introduced to manage capacity.
New York City also implemented dedicated World Cup corridors through Midtown Manhattan, including sections of 42nd Street and Fifth and Sixth avenues, while designating match days as “Gridlock Alert Days.”
These measures demonstrate that hosting a World Cup is not simply a stadium operation.
It is a metropolitan transportation project.
Permanent Infrastructure Could Strengthen The Long-Term Return
One argument in favor of absorbing some public costs is that certain World Cup investments remain useful after the tournament.
The New York New Jersey Host Committee highlighted the Secaucus Meadowlands Transitway as one example. The project improved connections between Secaucus Junction and the stadium and was intended to increase transportation capacity between the rail station and the venue.
During the tournament, more than 98% of fans entered the stadium before kickoff, while NJ TRANSIT completed post-match rail egress within hours. The Host Committee argues that the infrastructure will continue supporting future major events.
This creates an important distinction between an operating expense and a capital investment.
If a city spends money on temporary security barriers that disappear after the event, the long-term value may be limited.
If the same event accelerates a transit project, improves a station, upgrades public spaces or strengthens emergency-response infrastructure, the investment can continue producing value for residents.
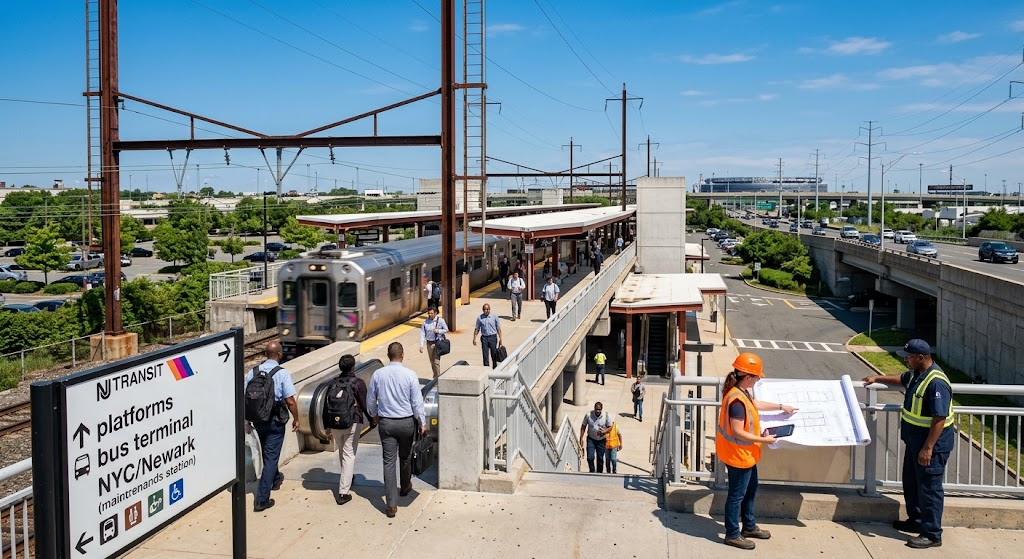
The economic analysis should therefore measure legacy value, not just tournament-period revenue.
That is particularly important in the New York metropolitan area, where transportation infrastructure serves residents every day.
The Regional Figure Hides A State-Level Question
The $3.5 billion headline also creates a geographic problem.
The report combines New York and New Jersey into one regional economy. That makes sense from an economic perspective because the metropolitan area functions as an interconnected labor, tourism and transportation market.
But it makes it harder to determine exactly how much economic activity each state captured.
Recent reporting has specifically noted that the final regional report does not provide a simple state-by-state breakdown of the $3.5 billion impact.
That matters because New Jersey hosted all eight matches at the stadium, while New York City and other parts of New York captured significant hotel, restaurant, entertainment and tourism spending.
The question becomes particularly relevant when evaluating public spending.
If New Jersey taxpayers absorb substantial transportation and infrastructure costs while a significant portion of visitor spending occurs in New York, policymakers may reasonably ask whether the current regional funding structure distributes costs fairly.
The opposite could also be true.
New Jersey businesses surrounding the stadium, including hotels, restaurants, transportation providers and entertainment venues, may have captured a significant share of the economic activity.
A detailed local analysis would be needed to determine the distribution.
New York City Turned The World Cup Into A Five-Borough Event
New York City’s strategy also demonstrates how a stadium event can extend into a broader urban tourism campaign.
The city’s World Cup program included free programming across all five boroughs, small-business initiatives, cultural events and fan experiences designed to ensure that the tournament reached communities beyond Manhattan and the stadium itself. Mayor Zohran Kwame Mamdani emphasized that the World Cup should be accessible to New Yorkers rather than functioning solely as a premium-ticket event.
That strategy could have economic implications.
A visitor who attends a match in New Jersey but spends two days exploring Queens, Brooklyn or the Bronx generates economic activity that would not appear in a stadium-only calculation.
Restaurants, neighborhood retailers, cultural institutions and local attractions can become part of the event economy.
This is one of the clearest differences between a sports event and a citywide tourism event.
The first concentrates activity around the venue.
The second uses the event as a platform for distributing visitors across the metropolitan area.
For New York, that distinction could determine whether the World Cup becomes a short-lived tourism spike or a longer-term marketing opportunity.
The $3.5 Billion Number Should Not End The Debate
The strongest interpretation of the new report is not that New York and New Jersey “won” the World Cup economically.
It is that the region has produced enough measurable activity to justify a much more detailed conversation about how mega-events should be evaluated.
The tournament generated approximately $1.9 billion in direct spending, $1.4 billion in labor income, $414.2 million in state and local tax revenue and 27,424 jobs. More than 1.27 million people either attended matches or traveled to the region for related World Cup activities.
Those are significant results.
But they should be placed alongside transportation costs, security spending, infrastructure investments, municipal services and the opportunity cost of public resources.
That approach is increasingly relevant for American cities considering major events.
Philadelphia is already commissioning its own independent analysis of the economic and fiscal impact of its 2026 World Cup, MLB All-Star Week and other major events. That study is expected to examine economic activity, tax revenue and distribution across industries and geographic areas.
The Bay Area has meanwhile provided a cautionary example: the Santa Clara Valley Transportation Authority reported an approximately $11 million loss associated with enhanced World Cup transportation and security services despite carrying roughly 230,000 World Cup riders.
Taken together, those cases suggest that the next generation of host-city analysis needs two columns.
One should measure what the event generated.
The other should measure what the public sector had to provide to make that generation possible.
Future Host Cities May Negotiate Differently
The New York-New Jersey experience could influence future host-city agreements because it demonstrates both the potential upside and the financial complexity of mega-events.
The region exceeded its original economic-impact projection. Hotels, restaurants, retailers, transportation companies and entertainment businesses benefited from visitor demand. Governments collected hundreds of millions of dollars in tax revenue. Transportation infrastructure was upgraded, and regional agencies demonstrated that they could move tens of thousands of fans efficiently.
But public agencies also carried substantial responsibilities.
That creates a new standard for cities considering future tournaments, Olympic events, Super Bowls, NCAA championships and international competitions.
Instead of asking only “How much economic impact will this event generate?”, host governments may increasingly ask:
- Who pays for additional transportation and security?
- Who receives the resulting tax revenue?
- Which neighborhoods capture visitor spending?
- Which infrastructure improvements remain after the event?
- How much of the projected impact represents genuinely new economic activity?
- What happens when actual costs exceed initial estimates?
Those questions could make future host-city agreements more sophisticated.
The most valuable legacy of the 2026 World Cup in New York and New Jersey may therefore be its ability to provide a real-world benchmark for the economics of mega-events.
The $3.5 billion figure is impressive, but its real importance lies in what policymakers do with the information behind it.
A successful host city should not simply generate a large economic-impact number.
It should be able to demonstrate that the resulting value is broadly distributed, that public costs are responsibly managed and that infrastructure investments continue serving residents after the final whistle.
New York and New Jersey now have the opportunity to turn the World Cup’s extraordinary numbers into a more rigorous model for how American cities should price, negotiate and measure the next generation of major sporting events.
